
It is also necessary to incorporate Edward Tufte’s laws into this task. So, who exactly is Edwarde Tufte? Edward R. Tufte is a retired political scientist, statistician, and computer scientist. His study focuses on statistical evidence and scientific visualisation (Shruthi Sampathkumar, Medium, 6 February 2018).
Effective web design can be achieved by following the broad information design principles proposed by Edward Tufte. In his article and books, he explains how to design web pages effectively using micro/macro design, layering and separation, small multiples, colour and information, and the integration of text and graphics (Shruthi Sampathkumar, Medium, 6 February 2018 ).
Tufte’s Comparison of Small Multiples
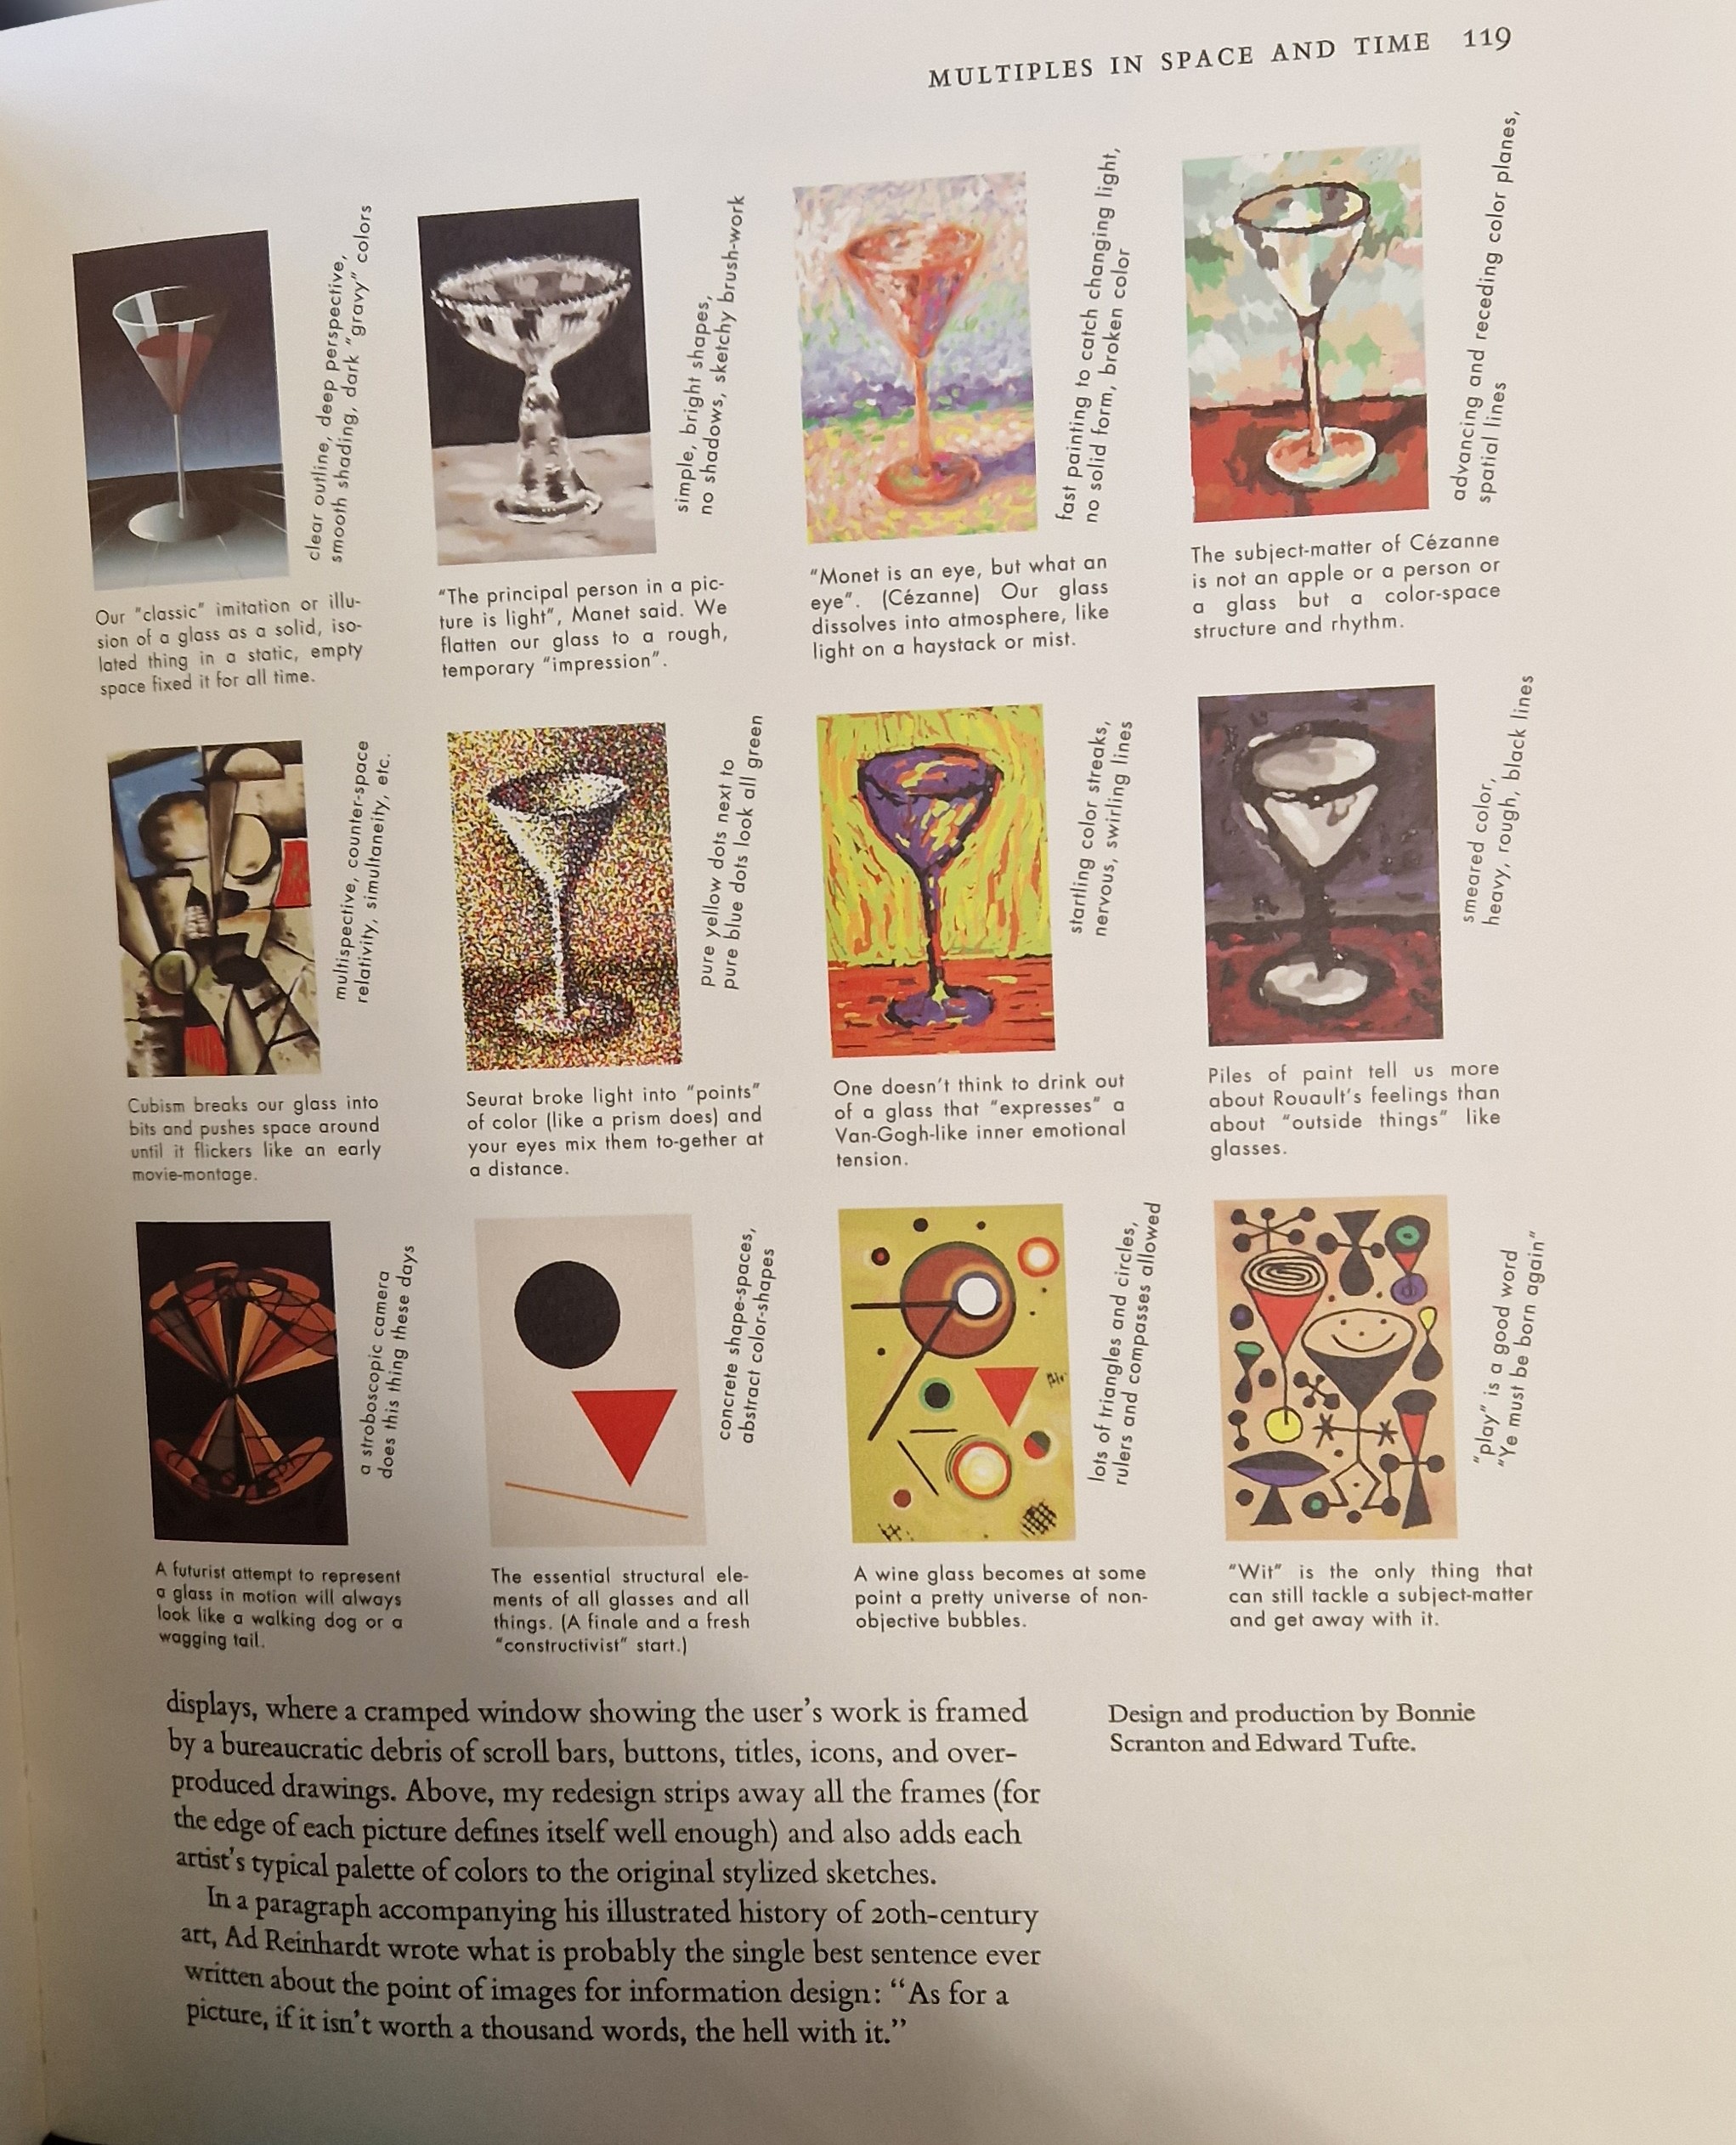
The small multiple is a data visualisation that consists of a grid of several charts. This makes it simple to compare the complete set of data. This law will be great because the Newton’s Cradle will include seven coloured balls. As a result, they will all be made of the same metal but in different colours.
Tufte’s Use of Colour
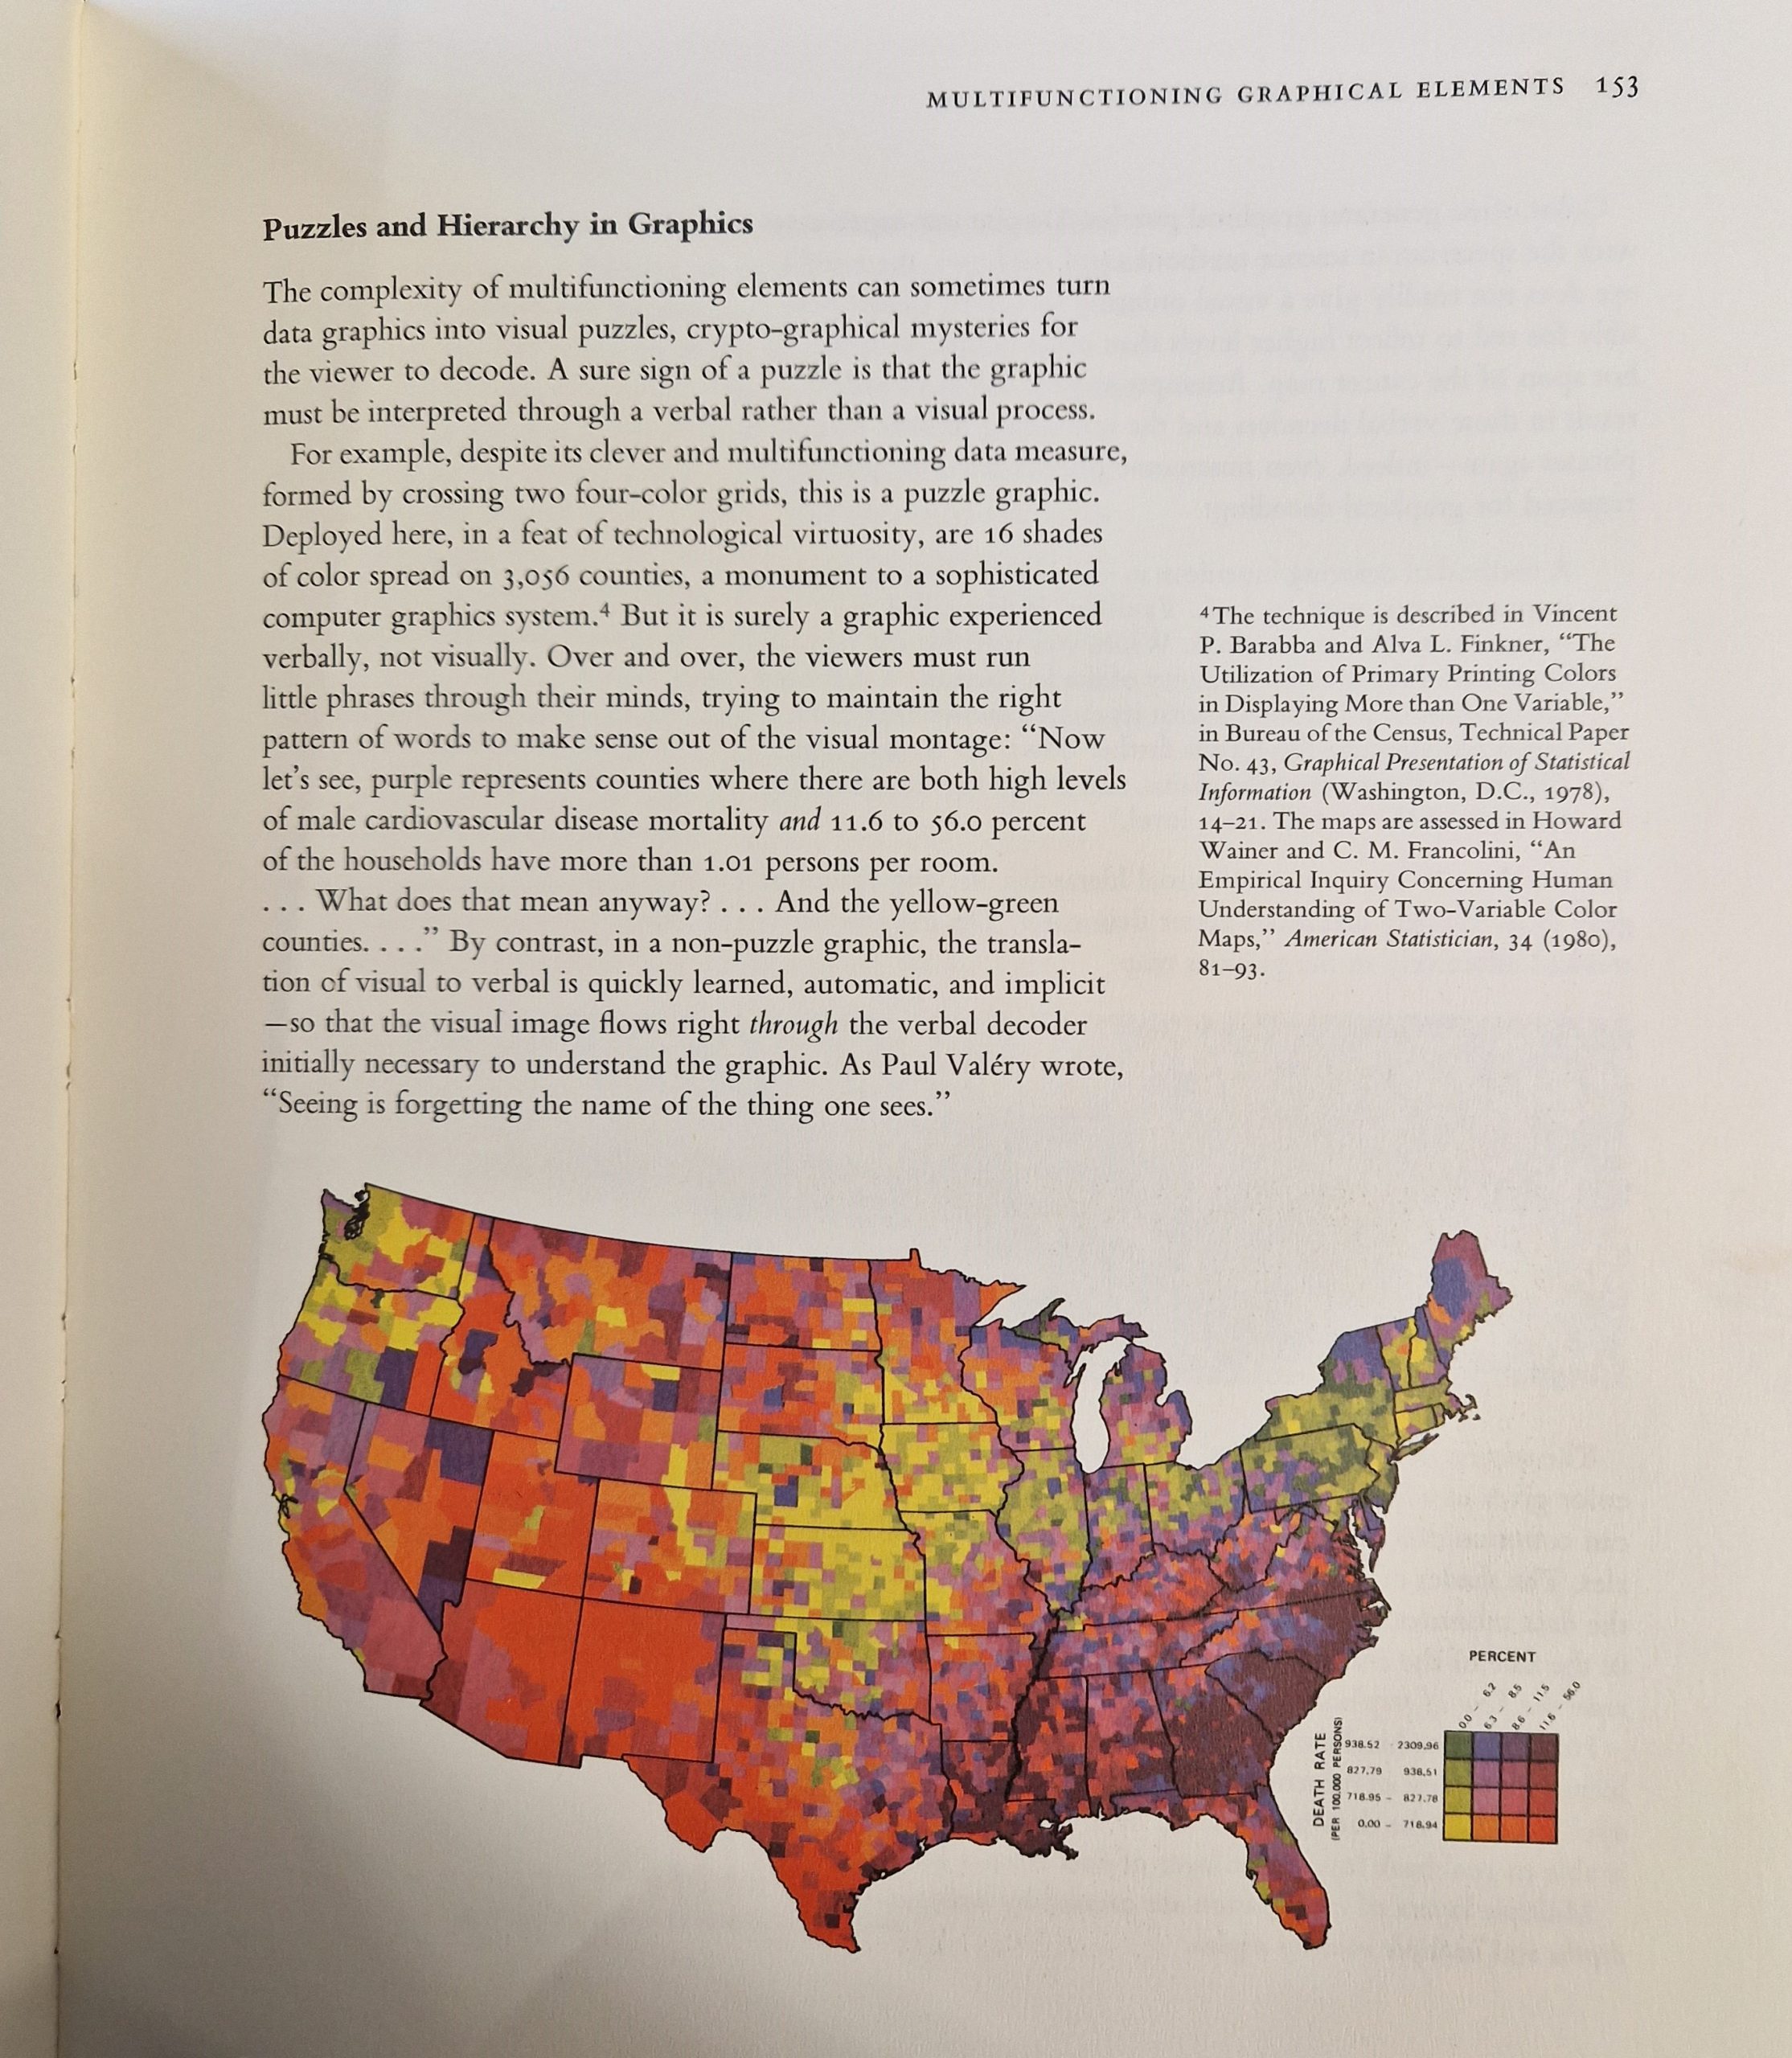
Colour is important for my animation because the setting is known for its blue, purple, and white hues. As the white light from the sun strikes the prism, it produces seven different colours, which is why the planets themselves will be in a prism colour also known as a rainbow colour to relate back to the space.
Tufte’s Micro-Macrocosm
In his works, Tufte discusses several micro- and macro-data instances. Micro readings come in a format that has the most granular details imaginable (Shruthi Sampathkumar, Medium, 6 February 2018 ). The planets in this space animation will serve as the microcosm and macrocosm because each one will have its unique story and small surface breaks. Additional cracks will also appear due to planetary movement.
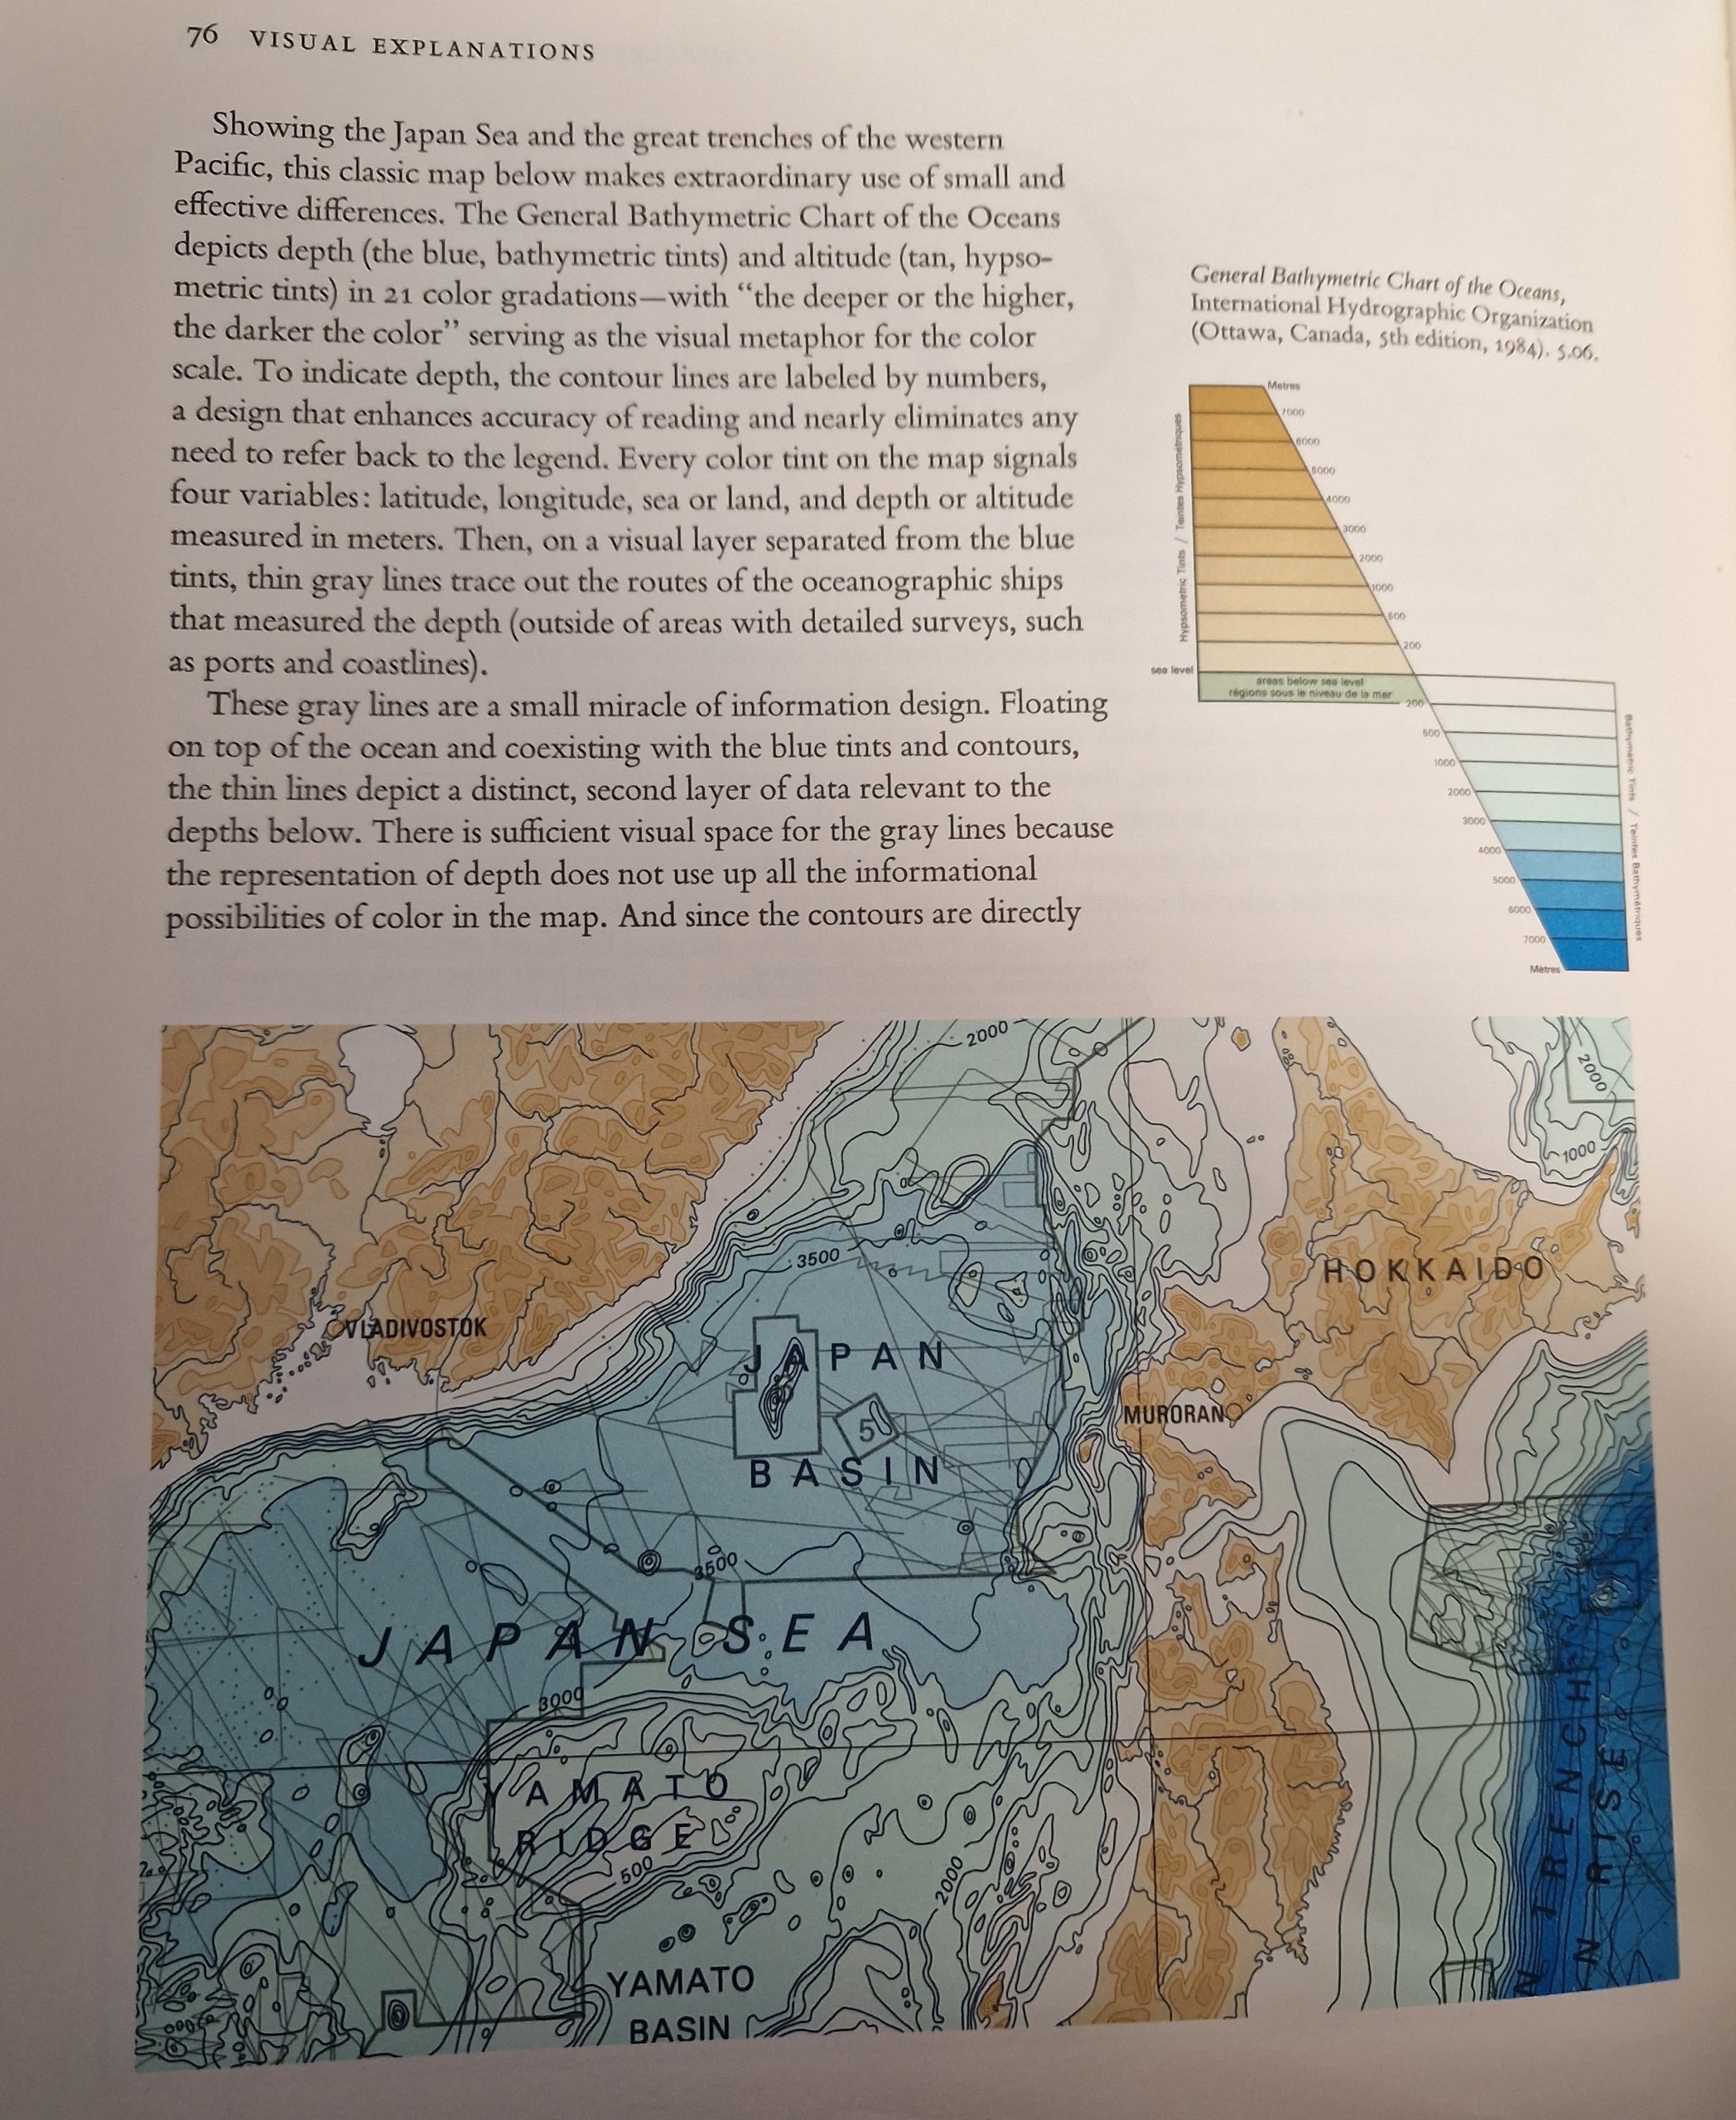
Tufte’s Layering and Separation
Layering is the process of visually arranging or stratifying data to build a proper link between different forms of information, according to Tufte’s definition in his article “Layering and Separation.” By emphasising more significant elements and downplaying less important content, layering serves to establish a visual hierarchy (Shruthi Sampathkumar, Medium, 6 February 2018 ). A layering component in animation would be found between the planets and the background.
References
Chrisanthy Rebecca Surya, Medium, 21 March 2019. How to Use Color in Data Visualization [Online] (n.d.) Available at : https://medium.com/fm-stories/how-to-use-color-in-data-visualization-829d6f0e70b4 [Accessed in 12 May 2023]
Shruthi Sampathkumar, Medium, 6 February 2018. Micro / Macro Readings [Online] (Updated in 6 February 2019) Available at : https://medium.com/@shurisk96/micro-macro-readings-cd987ce6bc63 [Accessed in 12 May 2023]
Tufte, Edward R, 1990, Envisioning information, Graphics, Cheshire.